

Defining Normal Price Action with the Behavioral
Transform Model
M. A. H. AlEssa
oisigma.com LLC
October 2025
Abstract
This paper defines normal price action as movement consistent with the statistical structure of recent returns. While raw price changes appear random, simple returns cluster around a local mean over rolling windows. The Behavioral Transform Model formalizes this pattern by projecting an expected price and one-standard-deviation envelope from the rolling mean and standard deviation of returns. Movements with in the envelope are behaviorally normal; breaches signal statistically and behaviorally significant events.
Applied to 100 years of S&P 500 data, the Transform contains adjusted closes about71% of the time, matching the theoretical expectation for a one-standard-deviation band. Intraday highs and lows are also contained at similar rates, showing that an envelope built from closing returns captures most of the day’s exploration. The findings support a behavioral interpretation: traders anchor on recent return distributions as a corridor of normality, and deviations mark exceptional market conditions.
1 Introduction
Markets are often described as random, yet repeated observations suggest otherwise. Traders consistently look to recent price action—daily returns, short-term volatility, recent high sand lows—to anchor expectations. If markets were purely random, such framing would be meaningless. Instead, the persistence of behavioral anchors suggests that historical returns contain useful information about the near future.
This paper introduces the Behavioral Transform Model, an adaptive framework that defines normal price action relative to recent history. It does not assume perfect rationality or equilibrium. Instead, it assumes that market participants rely on finite memory, limited horizons, and simple heuristics—most often, the average return and its dispersion. By capturing these tendencies, the model formalizes a behavioral notion of normality: price action is normal when it falls within the statistical envelope implied by recent returns, and abnormal when it breaches those expectations.
2 Theoretical Motivation
2.1 Rationality vs. Randomness
Classical financial theory often portrays price changes as a random walk, consistent with the Efficient Market Hypothesis (EMH) (Fama, 1970, 1991). Yet traders are not random: they are purposeful but boundedly rational agents (Simon, 1955) who rely on heuristics and
react systematically to recent outcomes (Kahneman and Tversky, 1979; Barberis and Thaler, 2003). This creates a paradox: if individual actions are systematic, why do aggregate price changes appear random? The resolution is that randomness is an emergent property at the
macro level, while conditional structure persists locally. Lo’s Adaptive Markets Hypothesis (AMH) (Lo, 2004) makes this explicit: efficiency is not a static condition but an evolving, context-dependent property shaped by competition and adaptation. A large body of evidence
documents short-horizon regularities—including return clustering, volatility clustering, and momentum effects (Mandelbrot, 1963; Cont, 2001)—showing that local statistical coherence can exist even if long-run prices approximate a random walk. The Behavioral Transform
builds on this insight by framing normal price action around the rolling mean and dispersion of recent returns, thereby capturing the local structure that emerges from bounded rational behavior.
2.1.1 Clustering of Returns Around a Mean
Although price changes may appear random when viewed in isolation, simple returns exhibit a tendency to cluster around a local mean when measured over finite horizons. This structure is subtle in compounded price levels, where scaling effects obscure coherence, but becomes
evident in rolling return series. The empirical mean of recent returns thus serves as a probabilistic anchor for near-term expectations.
The Behavioral Transform builds directly on this observation. By framing expectations around the rolling mean of returns, the model formalizes a central tendency that traders implicitly use in practice. Clustering does not imply persistent inefficiency, but it does demonstrate short-term coherence—a form of local stationarity—sufficient to guide the construction of an adaptive expectation envelope.
2.2 Bounded Rationality in Market Behavior
Traders rarely optimize across infinite information sets. Instead, they rely on bounded horizons: a 20-day volatility estimate, a 60-day trend, or recent support and resistance levels. This bounded rationality is not a weakness but a practical adaptation to complexity and limited attention. The Behavioral Transform encodes this directly: normality is inferred from the recent mean and standard deviation of returns. In this way, the model translates bounded rational behavior into a quantitative framework that distinguishes ordinary fluctuations from exceptional events.
3 Model Construction
Let xt denote the closing price at time t, and let Xt+1 be the next closing price. The one-step simple return is
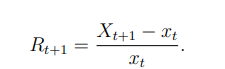
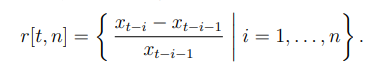
We assume Rt+1 is informed by the rolling distribution of recent returns r[t, n], defined as
3.1 Expected Return and Price
The behavioral expectation uses the sample mean on the rolling window:

To avoid look-ahead bias, the envelope constructed at time t − 1 is evaluated against the realized xt
3.2 Normal Envelope
Normal price action is defined by one standard deviation around the mean return:

The interval [E−, E+] defines the range of behaviorally normal price action.
4 Interpretation
- Normal Price Action: When closes remain within the envelope, behavior is consistent with recent expectations.
- Abnormal Price Action: Breaches indicate events outside behavioral expectations—shocks, clustering, or sentiment-driven moves.
- Behavioral Horizons: The choice of window n reflects memory length (e.g., monthly or quarterly), consistent with how traders perceive risk.
5 Empirical Observations
Repeated application of the Behavioral Transform reveals:
- Containment rates near 68% for one standard deviation under normal conditions
- Breaches cluster around volatility events, confirming that “abnormal” price action is not random but regime-driven.
- Even applied to random walks, empirical containment exceeds 50%, suggesting that short-term structure exists even under null conditions.
5.1 Containment of AdjClose, Close, High, and Low
To test the Behavioral Transform against different reference points, we evaluated the percentage of times the adjusted close, raw close, daily high, and daily low fell within the envelope constructed from adjusted close returns, using a 100-year sample of the S&P 500with a 60-bar rolling window. The results were as follows:
- AdjClose containment: 71.26%
- Close containment: 71.26%
- High containment: 68.01%
- Low containment: 66.15%
- Global MAPE (AdjClose vs. E): 0.77%
These results confirm that the Transform envelope contains daily closes at frequencies consistent with theoretical expectations for a one-standard-deviation band, while highs and lows are also captured at slightly lower but still substantial rates. This suggests that an envelope derived solely from closing returns not only captures settlement behavior but also much of the intraday price exploration.
From a behavioral perspective, this implies that market participants anchor on closing return distributions in a way that constrains intraday price discovery. Highs and lows that remain within the Transform bounds can be interpreted as normal volatility, while closes that breach them signal a statistically and behaviorally significant rupture. This reinforces the Transform’s role as a framework for defining normality in both settlement and intraday price dynamics.
Taken together, these results show that while returns cluster around a mean that defines a probabilistic corridor for closes, this same corridor is often wide enough to encompass intraday highs and lows. The Transform therefore captures not only the settlement behavior of the market but also the majority of intraday price exploration, grounding its behavioral definition of normality in observable statistical patterns.
6 Conclusion
Empirical evidence confirms the model’s validity. In a 100-year sample of the S&P 500,adjusted closes were contained within the one-standard-deviation envelope about 71% of the time, consistent with theoretical expectations. Daily highs and lows were also contained at comparable rates, indicating that an envelope derived from closing returns is broad enough to capture much of the intraday price exploration. Breaches, therefore, mark not routine volatility but statistically and behaviorally significant ruptures.
Although raw price changes may appear random, rolling return distributions exhibit short-term coherence that provides a natural anchor for framing expectations. From a behavioral perspective, the Transform illustrates how market participants implicitly anchor on these recent return distributions, treating them as a corridor of normality that guides both settlement and intraday discovery. By reframing randomness as an emergent illusion and normality as an adaptive envelope, the model bridges statistical structure and trader cognition. It thus offers both a theoretical lens for understanding price dynamics and a practical framework for distinguishing ordinary fluctuations from exceptional events.
References
Barberis, N. and Thaler, R. (2003). A survey of behavioral finance. In Handbook of the Economics of Finance, volume 1, pages 1053–1128. Elsevier.
Cont, R. (2001). Empirical properties of asset returns: stylized facts and statistical issues. Quantitative Finance, 1(2):223–236.
Fama, E. F. (1970). Efficient capital markets: A review of theory and empirical work. The Journal of Finance, 25(2):383–417.
Fama, E. F. (1991). Efficient capital markets II. The Journal of Finance, 46(5):1575–1617.
Kahneman, D. and Tversky, A. (1979). Prospect theory: An analysis of decision under risk. Econometrica, 47(2):263–291.
Lo, A. W. (2004). The adaptive markets hypothesis: Market efficiency from an evolutionary perspective. The Journal of Portfolio Management, 30(5):15–29.
Mandelbrot, B. (1963). The variation of certain speculative prices. The Journal of Business,36(4):394–419.
Simon, H. A. (1955). A behavioral model of rational choice. The Quarterly Journal of Economics, 69(1):99–118.