
Same idea you already use — a volatility band around price — but measured in return space instead of on raw price. So it doesn’t lag or balloon in a trend, and it’s calibrated: across 40 instruments, the next close lands inside the band about as often as it should. Built for TradingView.
If your Bollinger Bands® “work” in a range and then fall apart in a trend, you’re not doing it wrong — it’s how the math is built. Two things compound:
Neither is a settings problem. Tightening or widening the multiplier doesn’t fix a band that’s measured on the wrong thing.
BTM (the Behavioral Transform Model) builds the same kind of band, but from percentage returns anchored to the prior close rather than from raw price levels. That one change fixes both problems: the band stays centered on where price actually is, and its width tracks the dispersion of returns — genuine volatility — instead of the trend. It recalculates every bar and uses only information available at the prior close, with no lookahead.
To be fair to Bollinger Bands®: they were never designed as a calibrated containment band. John Bollinger built them as a relative gauge of whether price is high or low and how volatile the market is, meant to be read alongside other indicators. We lead with containment because it’s the most intuitive measure — and the job most traders use a band for — but it isn’t the only thing the working paper checks. The obvious objection is that a band can win on coverage just by being wider; tested at matched coverage, the return-space band is the tighter one, and on the Winkler interval score (which penalizes width and misses together) standard Bollinger Bands® scored about 2.3–3.8× worse. Better-covered and sharper, not looser.
| Property | Standard Bollinger Bands® | BTM |
|---|---|---|
| Measured on | Raw price (SMA ± SD of price) | Returns (% moves anchored to prior close) |
| Centering | 20-period moving average (lags) | Anchored to the prior close |
| In a strong trend | Drifts off-center; balloons | Stays centered; width tracks real volatility |
| Repainting / lookahead | None at standard settings | None — strictly causal by design |
| Designed as a calibrated range? | Not by design | Yes — calibration is the design goal |
| ±1 (inner) band containment* | ~40% | ~71% |
| ±2 (outer) band containment* | ~83% | ~94% |
| Sharpness at equal coverage* | Wider — 1.6–4.8× the median width | Tighter |
| Purpose | Relative read of whether price is high/low + how volatile the market is | The expected range, and whether price is normal (inside) or abnormal (outside) |
*Measured historically in the working paper across 40 instruments. Containment = how often the next close landed inside the band — inner-band figures compare both methods at identical settings; outer-band figures compare BTM at ±2σ with Bollinger Bands® at their ±2SD default. Sharpness compares median band width at matched coverage; on the Winkler interval score (which penalizes width and misses together) standard Bollinger Bands® scored about 2.3–3.8× worse. Past behavior is not a guarantee of future results.
BTM looks like Bollinger Bands®, so the working paper ran them head-to-head on the same data.
BTM contained the next close ~70% of the time; price-based Bollinger Bands® managed only ~40%.
BTM held ~94% versus ~83% for standard Bollinger Bands® — and contained price more reliably on every one of the 40 instruments tested, at both inner and outer band.
Most of the difference comes from measuring volatility in return space rather than on raw price, which keeps the band centered in a trend instead of lagging and ballooning.
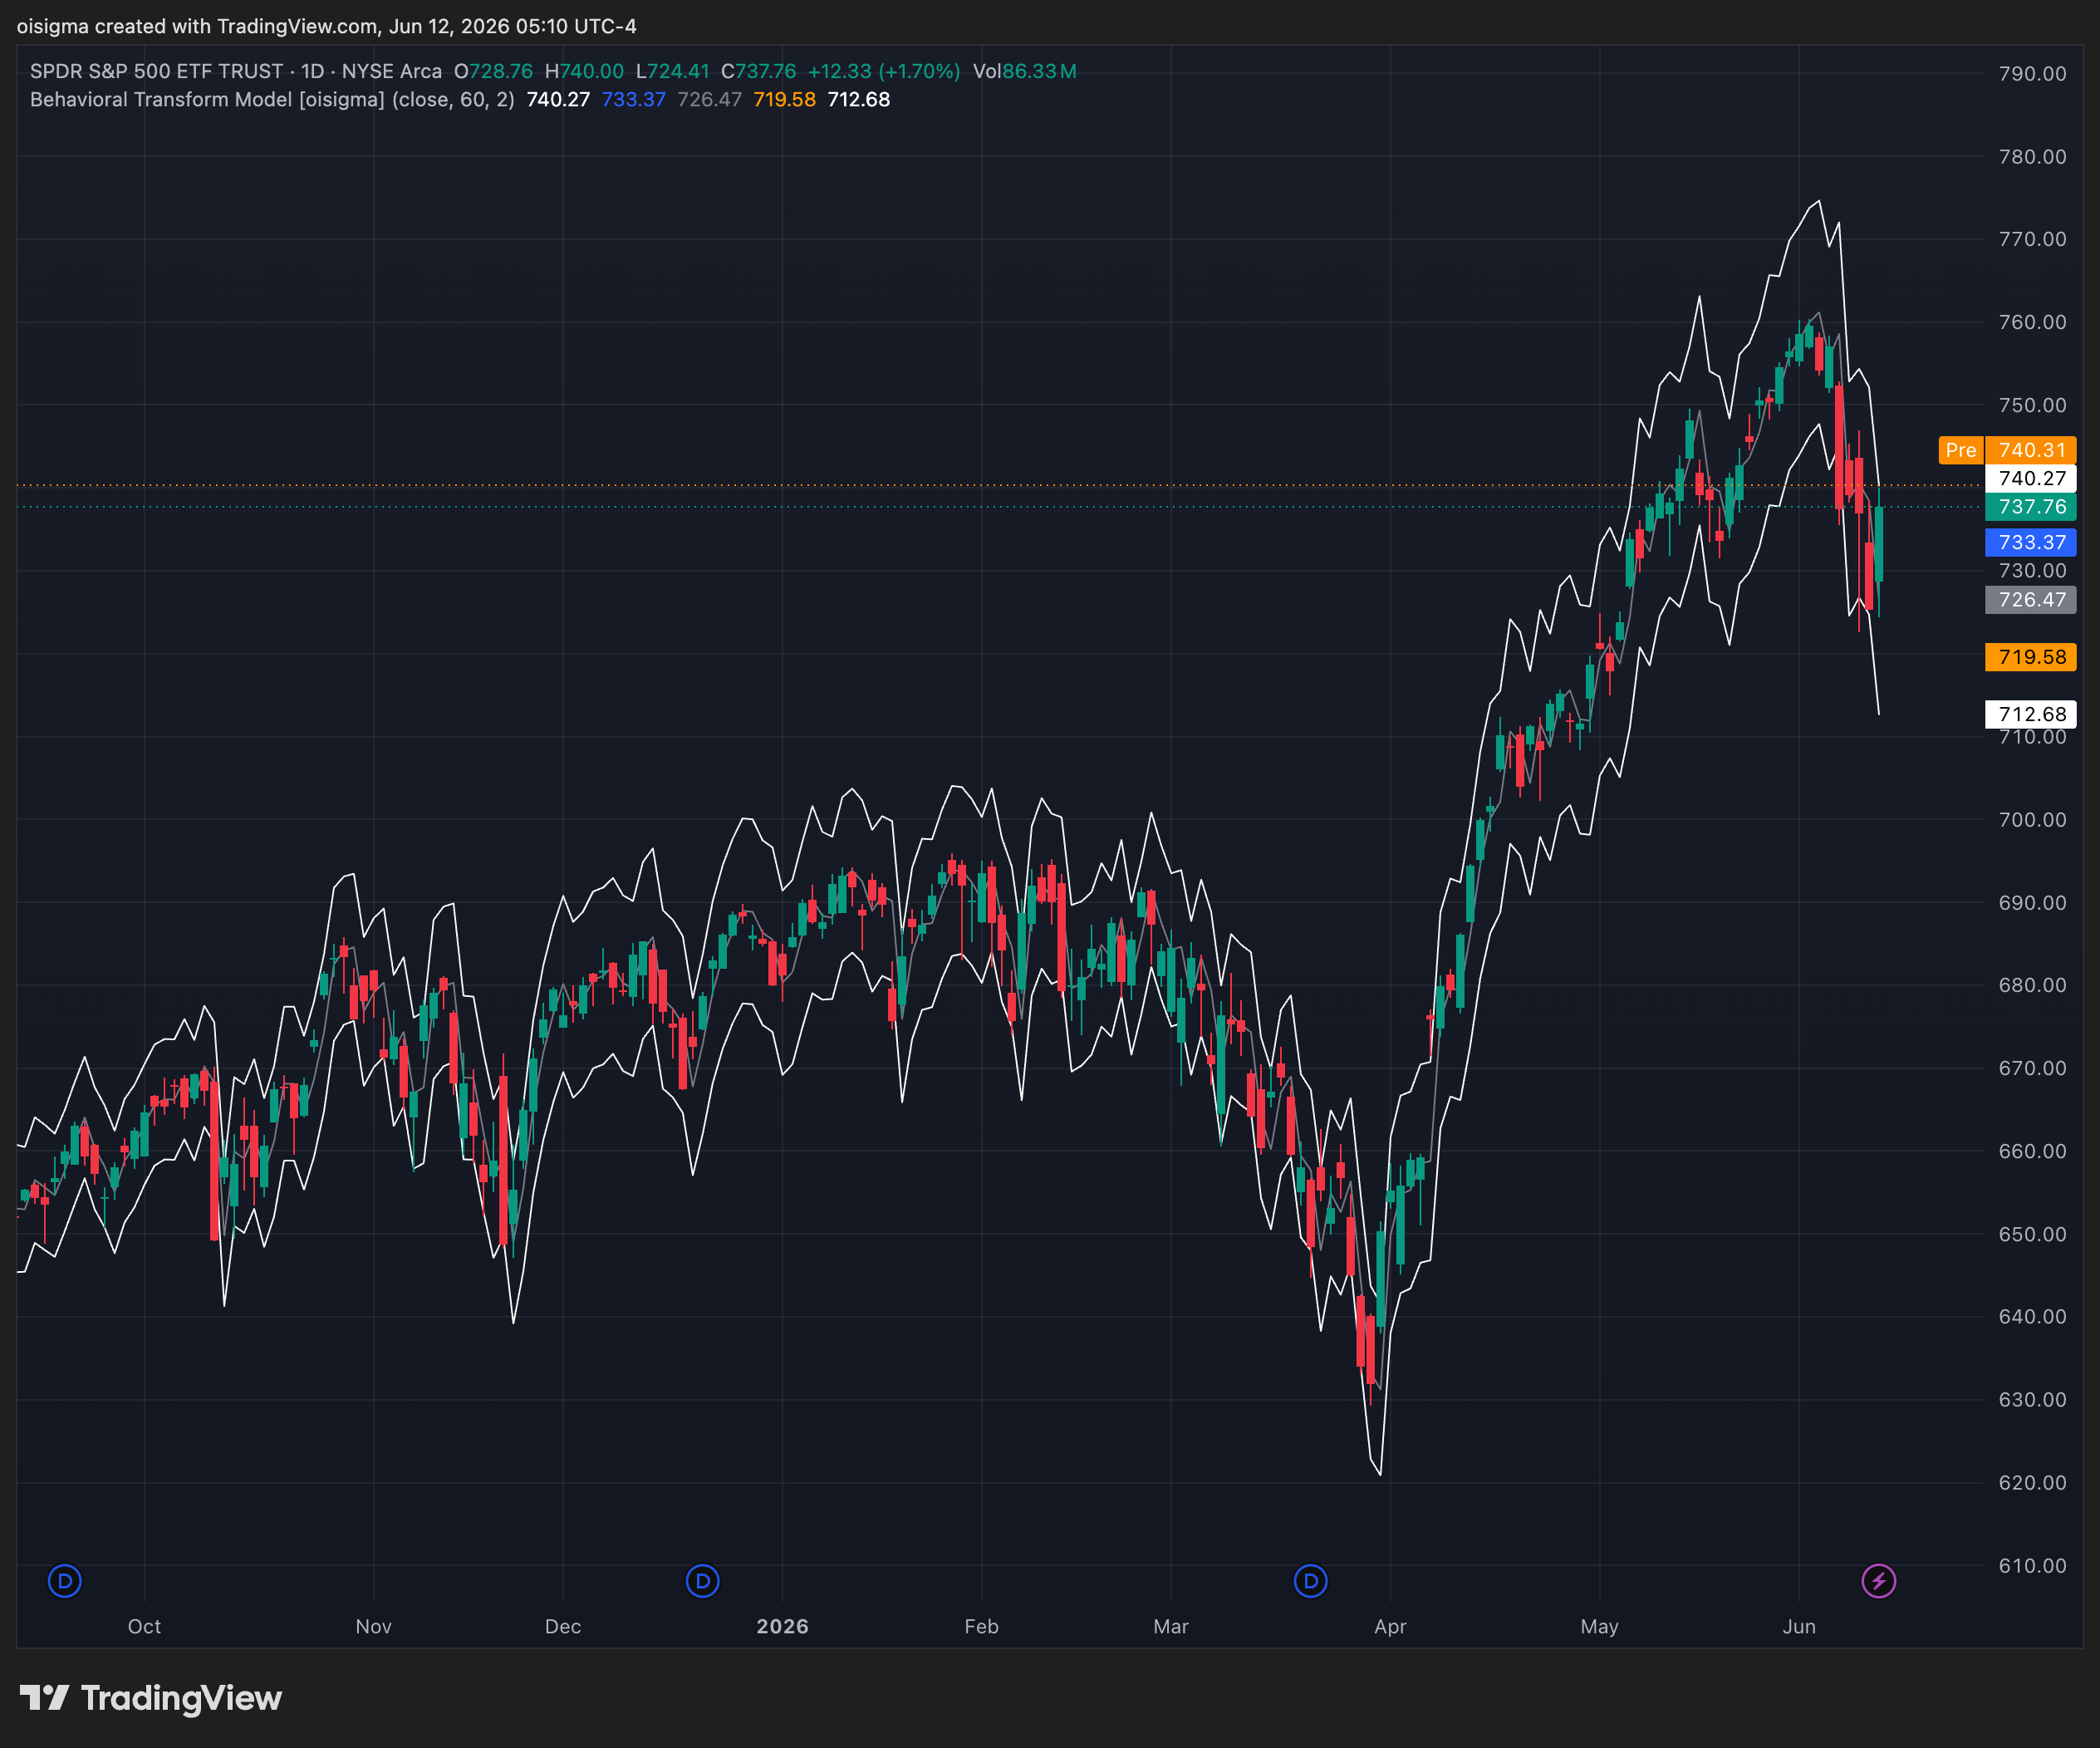
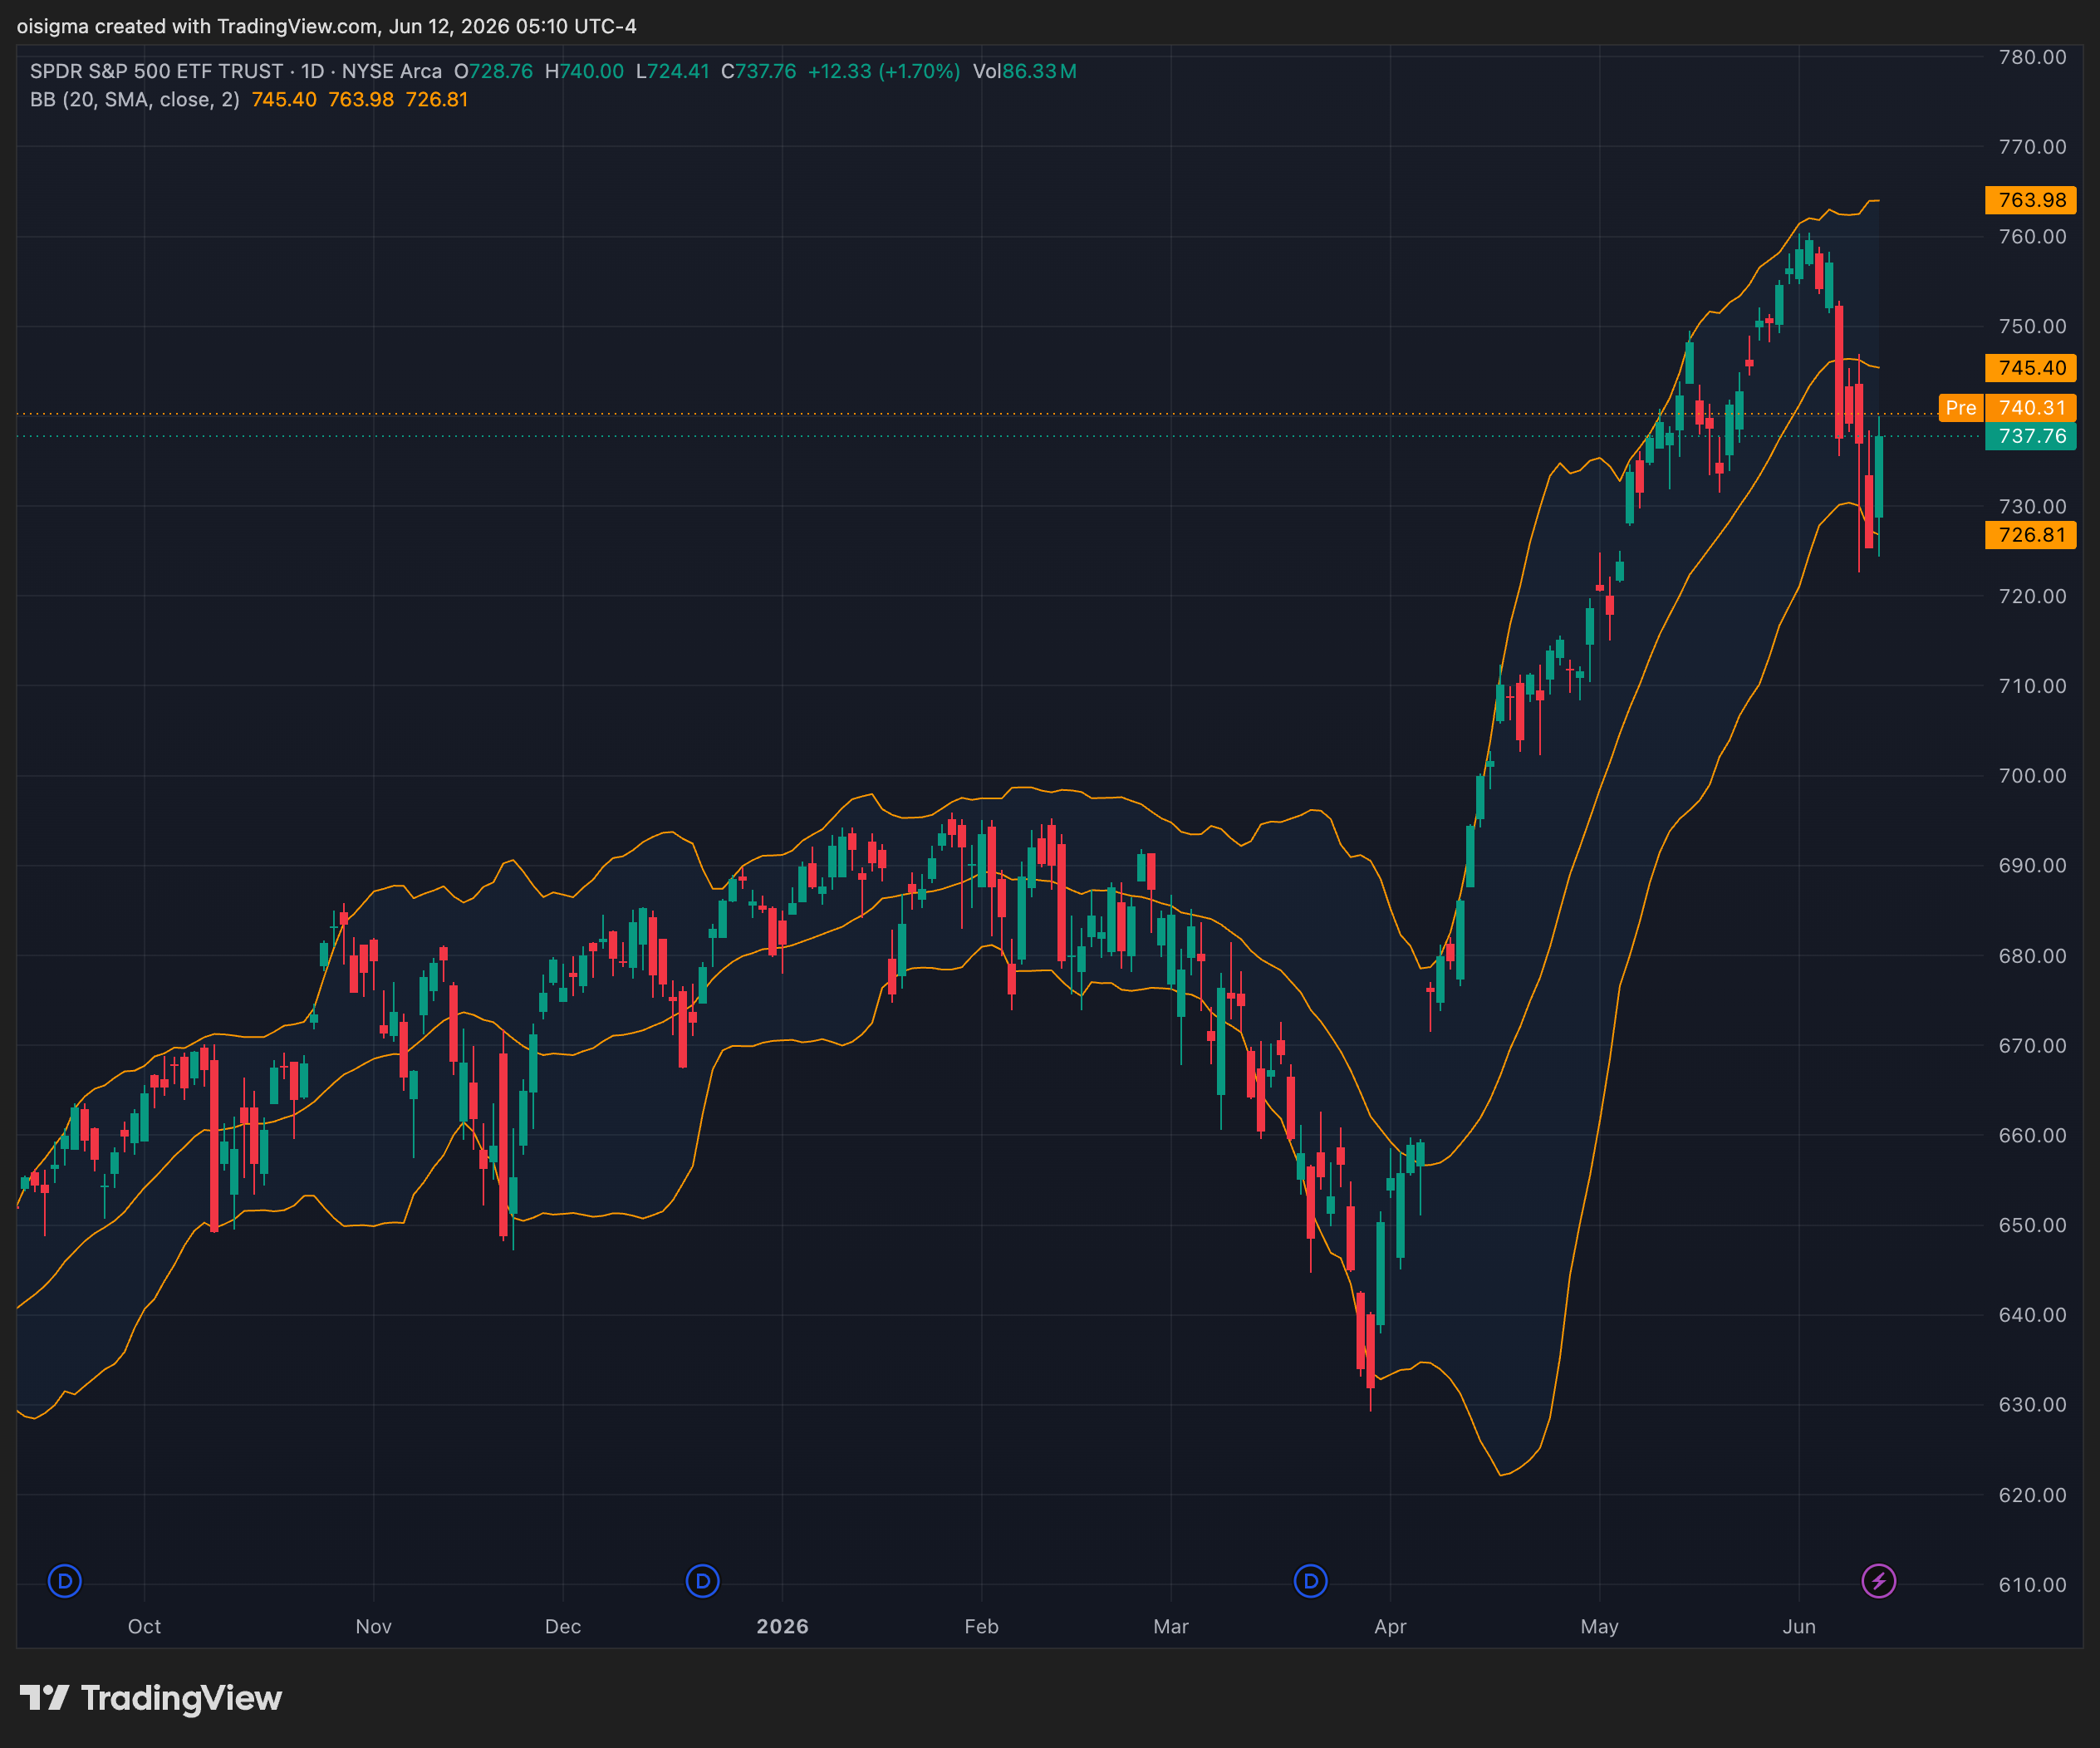
Same chart, two methods. Both panels show SPY daily candles from October 2025 to June 2026. Left: BTM's ±2σ band, measured in return space and recalculated every bar from the prior close. Right: standard Bollinger Bands® at their ±2SD default (20-period SMA, ±2 standard deviations of price). Notice how the price-based band lags and sits off-center through the April–June rally, while BTM's return-space band hugs price more symmetrically. Across the full 40-instrument test, ~94% of closes stayed inside BTM's band versus ~83% for standard Bollinger Bands® — the stretch shown is one illustrative example. Historical, not a recommendation; comparison on the containment metric only.
The same ~71% containment holds far beyond this comparison — across 97 years of the S&P 500 (it stayed within 68.7–73.7% in every decade) and 40 instruments in five asset classes, and on the calibration task it’s statistically indistinguishable from the volatility models institutions use, like GARCH and RiskMetrics®. The full decade-by-decade and cross-instrument tables live on the evidence page.
The honesty is the point. In a category full of overclaiming, here’s what the model does not do:
It does not predict price or direction. It describes where price is relative to its recent range; the center line carries almost no directional information.
It is not a signal service. No arrows, no entries, no “buy/sell.” It’s descriptive context for your own decisions.
It is well-calibrated on average, not in every moment. It’s a marginal-coverage classifier, not a perfect conditional forecast — formal tests confirm the average is right but the fit isn’t textbook-perfect.
The outer band is slightly optimistic in the deep tails, and the range runs too narrow in the first days of a fast crisis (when volatility spikes faster than recent history can register — containment fell to ~65% on the most extreme onset days). We’d rather tell you that than pretend otherwise.
It will not make you money on its own. It’s an analysis lens; profit depends on your own strategy, discipline, and risk management — and trading always carries the risk of loss.
We don’t ask you to take our word for it. The full working paper documents the method, every figure above, the statistical tests, and the limitations in detail. It’s a working paper — complete and citable, but not yet peer-reviewed — and comments are welcome.
AlEssa, M. A. H. (2026). “How Well Does a Rolling-Volatility Band Calibrate? Evidence Across Asset Classes and Market Regimes.” oisigma.com LLC. Not peer-reviewed.
Because they’re centered on a lagging moving average of price and their width is the standard deviation of price levels — in a trend that average sits behind price and the width counts the trend as volatility, so the close prints outside the band. Measuring the band on returns (anchored to the prior close) fixes both.
For traders who want an objective, calibrated range, a return-space band like BTM contained price more reliably than standard Bollinger Bands® on every one of 40 instruments tested (at default settings, on the containment metric). It’s the same idea, measured the way that calibrates.
On the specific, measurable question of how often the next close lands inside the band, yes — about 94% vs 83% at the 2σ band, on all 40 instruments tested, historically. And not by being wider: at matched coverage it’s the tighter band, so it isn’t winning on a loose, oversized envelope. It’s a different tool in spirit, though: descriptive context, not a signal generator, and it doesn’t predict direction.
No. It uses only information available at the prior bar’s close, with no lookahead in the volatility estimate. Once a bar closes, its band and markers are fixed.
It’s an alternative for the job most people use bands for — judging where price is “supposed” to be and when a move is unusual. Many traders run it instead of, or alongside, their existing bands.
No. BTM is descriptive market analytics for educational use — not investment advice, not buy/sell signals.
The evidence is the band’s calibration. The best way to judge it is to watch it recalculate on the markets you actually trade.
Start your free 30-day trial →30-day free trial, then $15/month billed monthly — auto-renews until you cancel. Cancel anytime.
Pick up where you left off.