Behavioral Support & Resistance for TradingView


Identify where price is expected to be and when it becomes abnormal based on recent market behavior.

Problem
Why Support & Resistance Is Inconsistent
Most traders draw support and resistance differently.
Levels move.
Lines get redrawn.
What looked like support suddenly breaks.
Two traders can look at the same chart — and see completely different levels.
There’s no consistent way to define where price should be.
So it becomes hard to tell:
Is this move normal?
Or is something actually changing?
Reframe
The Missing Piece: What Is "Normal" Price?
Every market has a short-term memory.
Price moves relative to recent behavior — not in isolation.
From this, a pattern emerges:
Price tends to stay within a normal range.
And when it moves outside that range — something different is happening.
SOLUTION IDEA
A Different Way to Define Support & Resistance
Instead of drawing static lines…
Support and resistance can be defined directly from how the market has been behaving.

This creates:
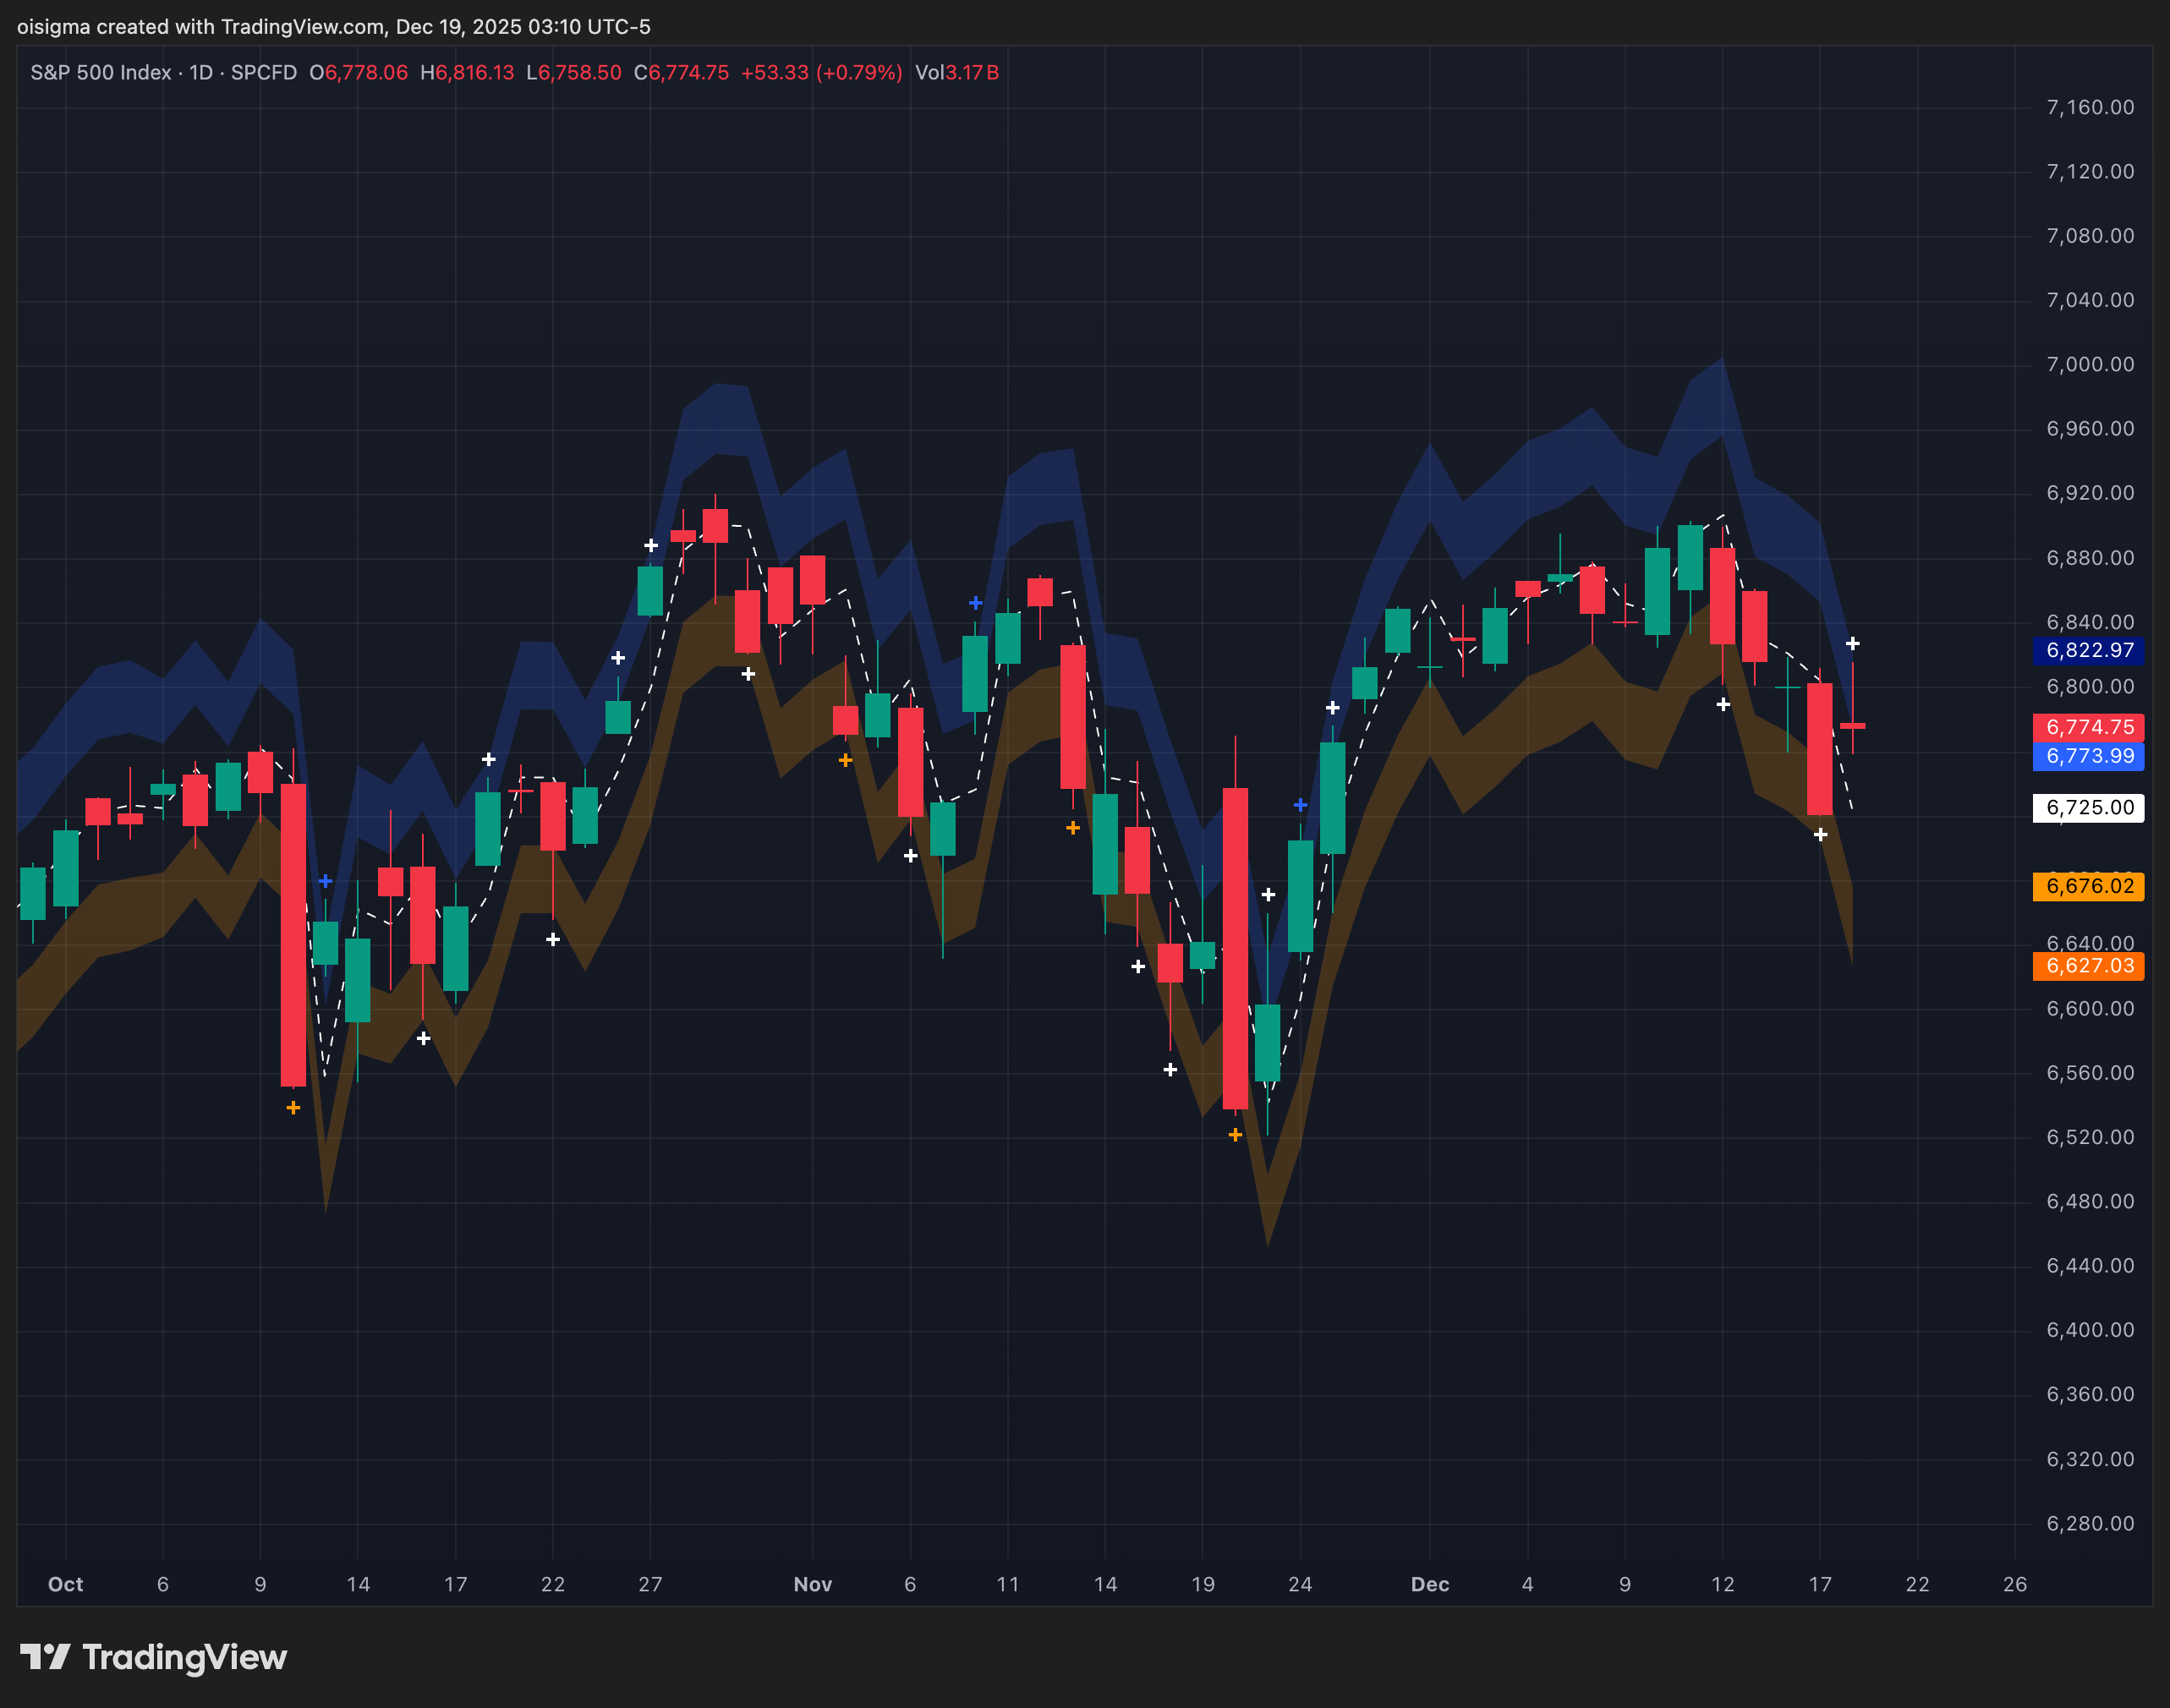
S&P 500 Index daily candlestick chart showing fluctuating prices with blue and brown bands from October to December.
A central expectation
Frames price relative to its recent behavioral range, helping distinguish routine movement from extension.
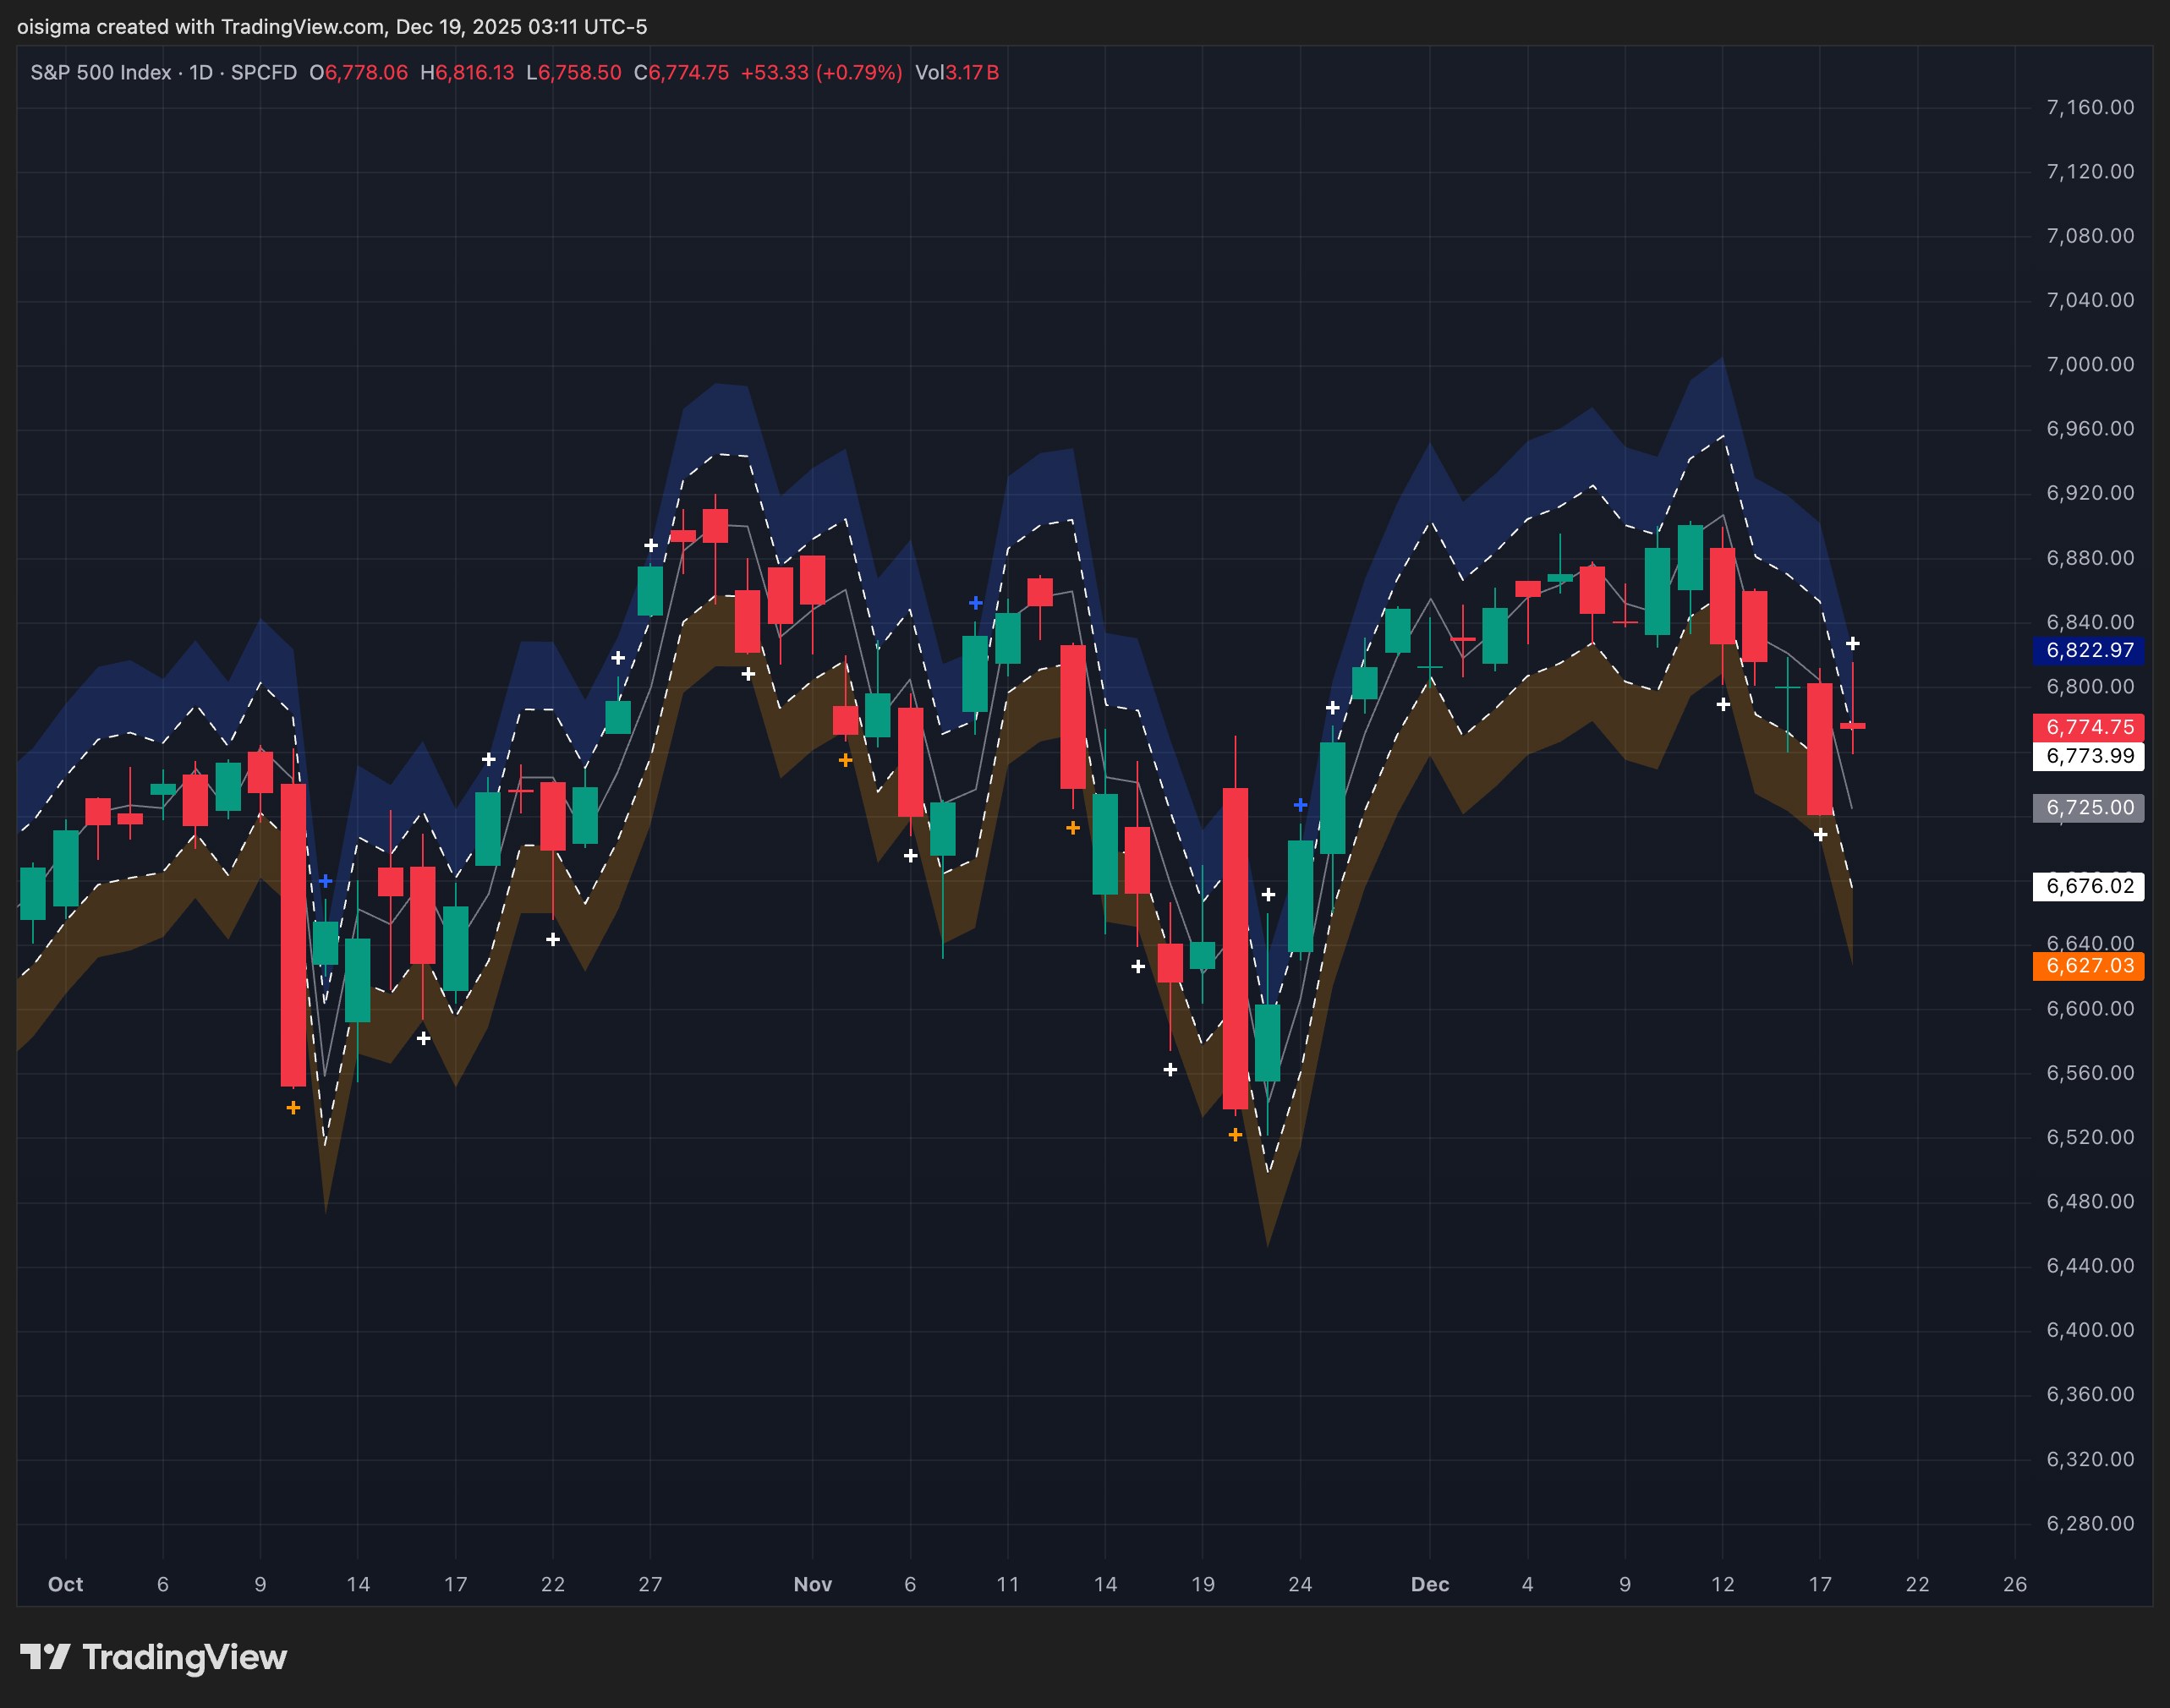
Trading chart of S&P 500 Index daily candlesticks with colored bands showing price bounds from October to December.
A range of normal movement
Automatically derived zones that evolve with market conditions — no hand-drawn or static levels.
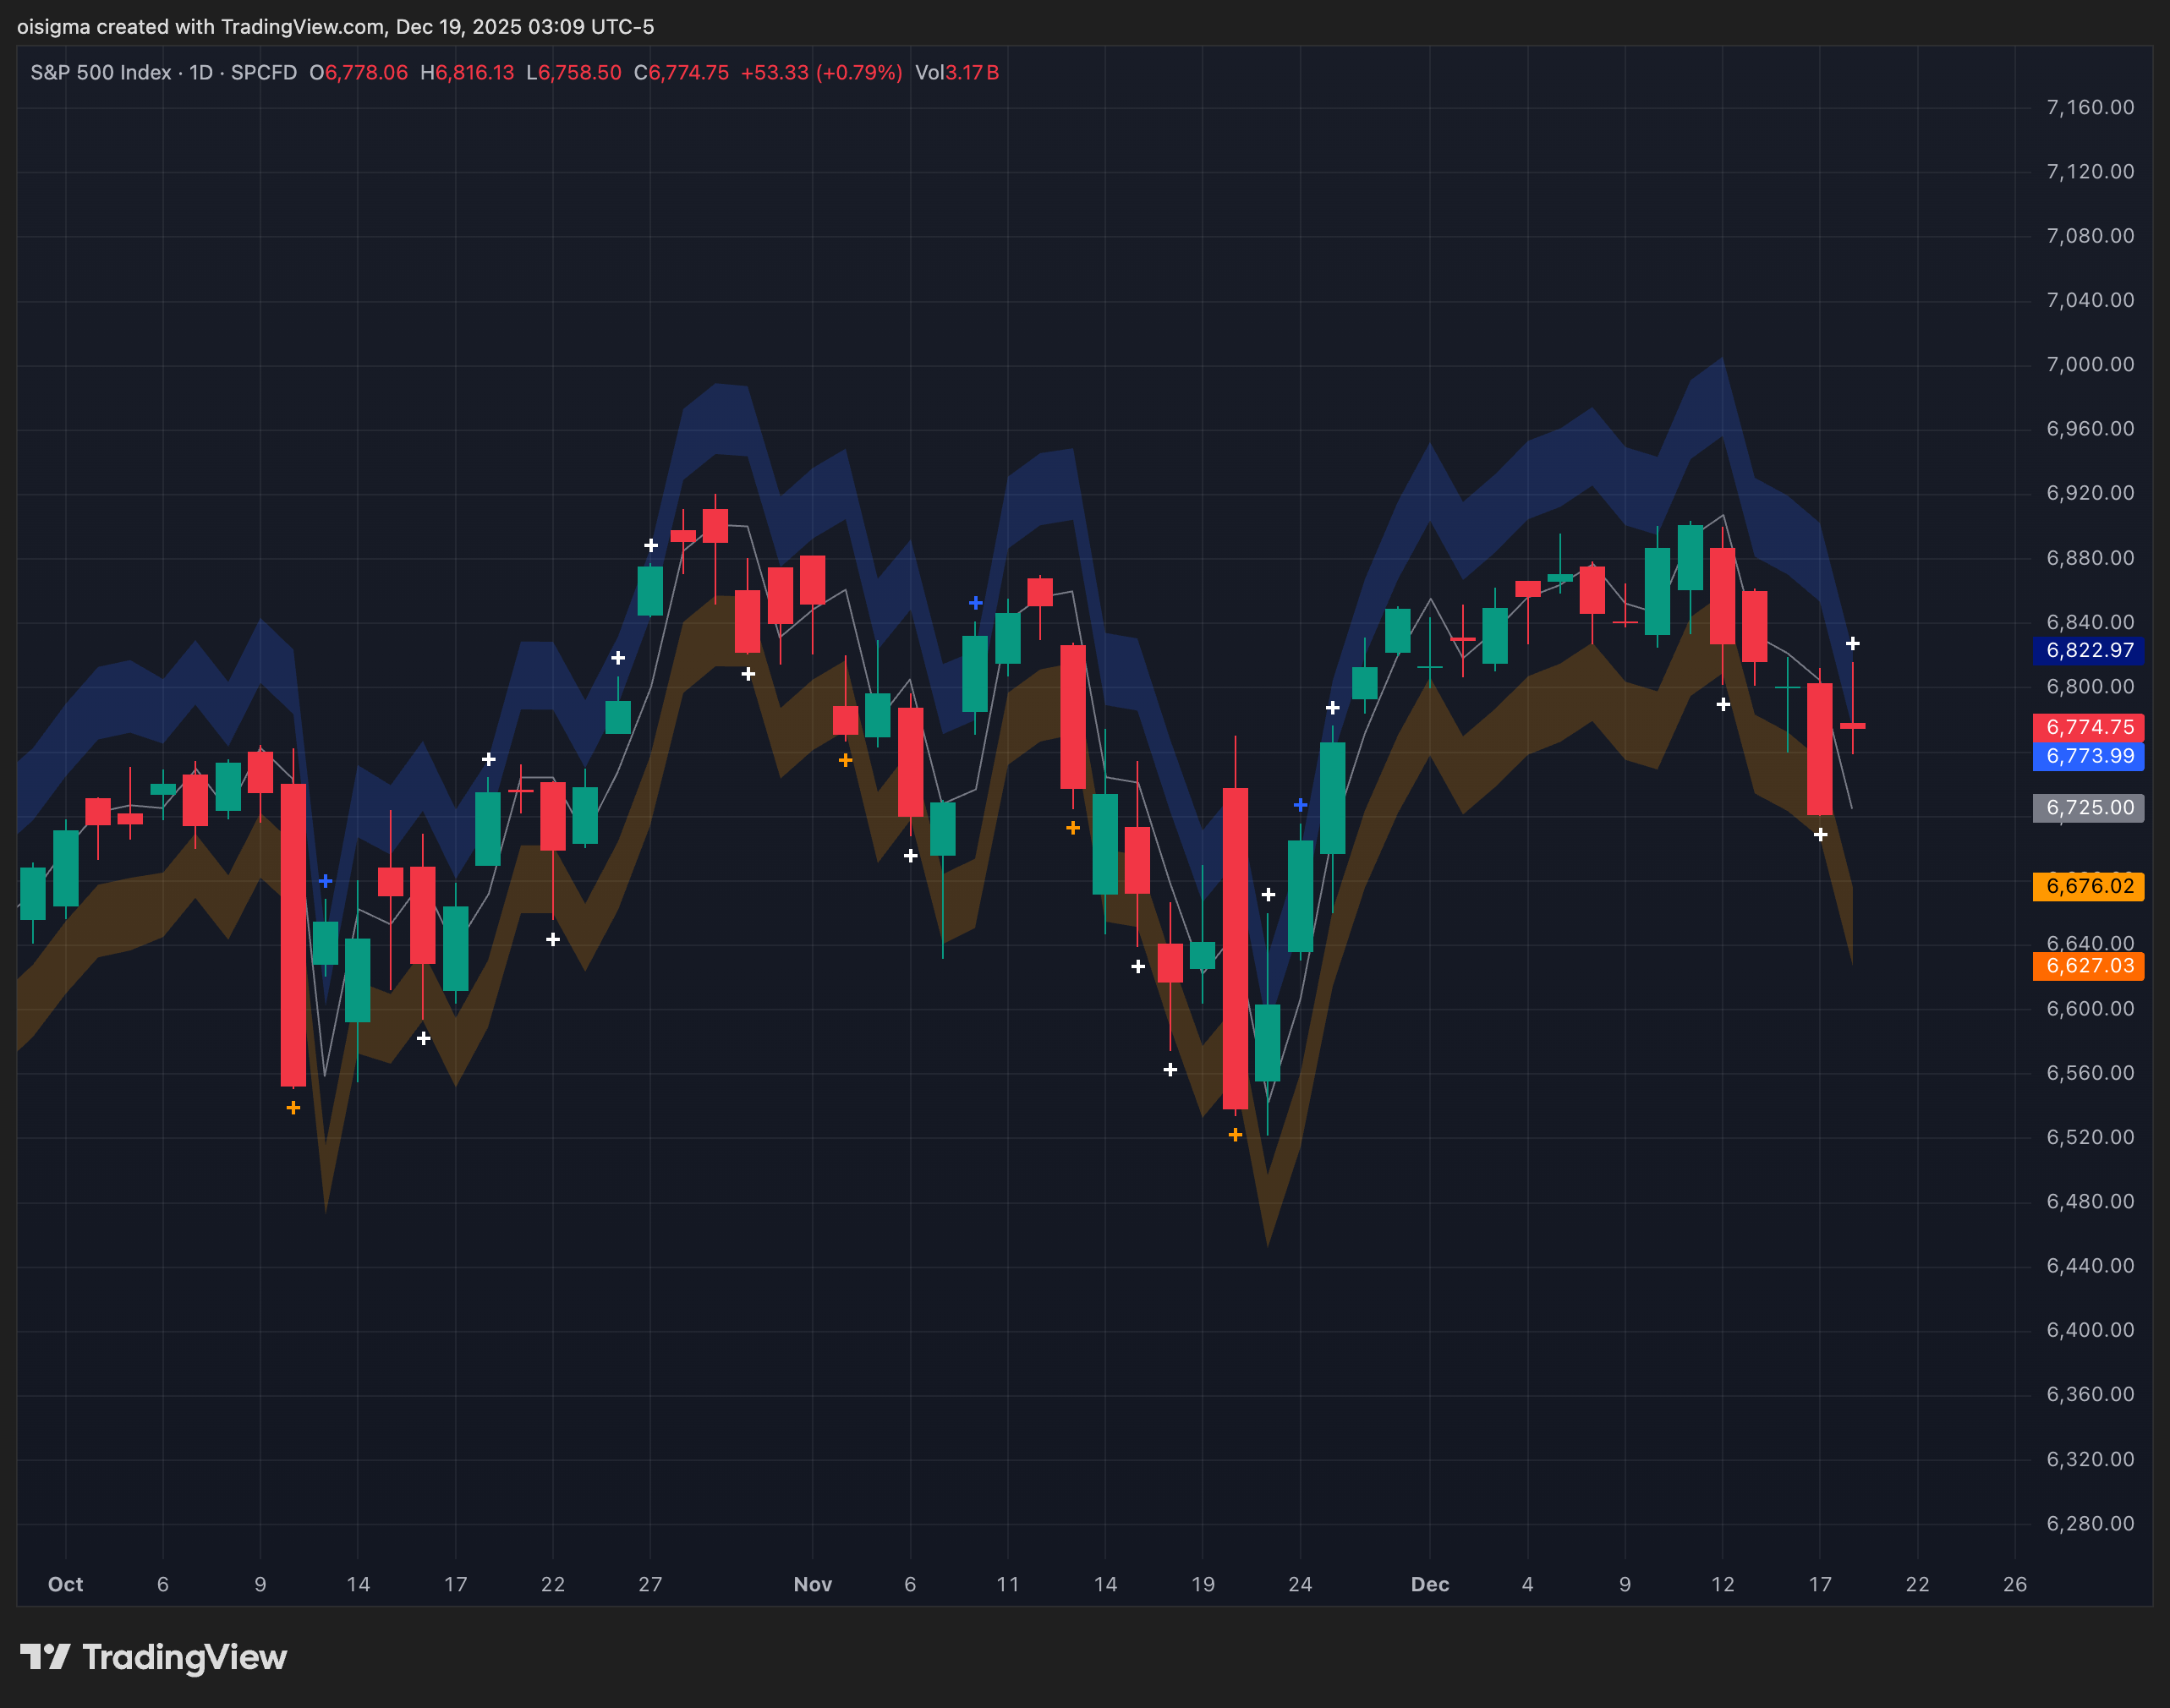
S&P 500 daily candlestick chart showing price fluctuations from October to December with volume 3.17 billion.
Clear boundaries where behavior becomes unusual
Highlights when price moves beyond typical ranges, providing context as volatility increases.
These levels are not subjective.
They update automatically — every bar.
shift
What This Changes
Instead of asking:
“Where should I draw support and resistance?”
You can ask:
Is price behaving normally… or not?
Price shifts between states:
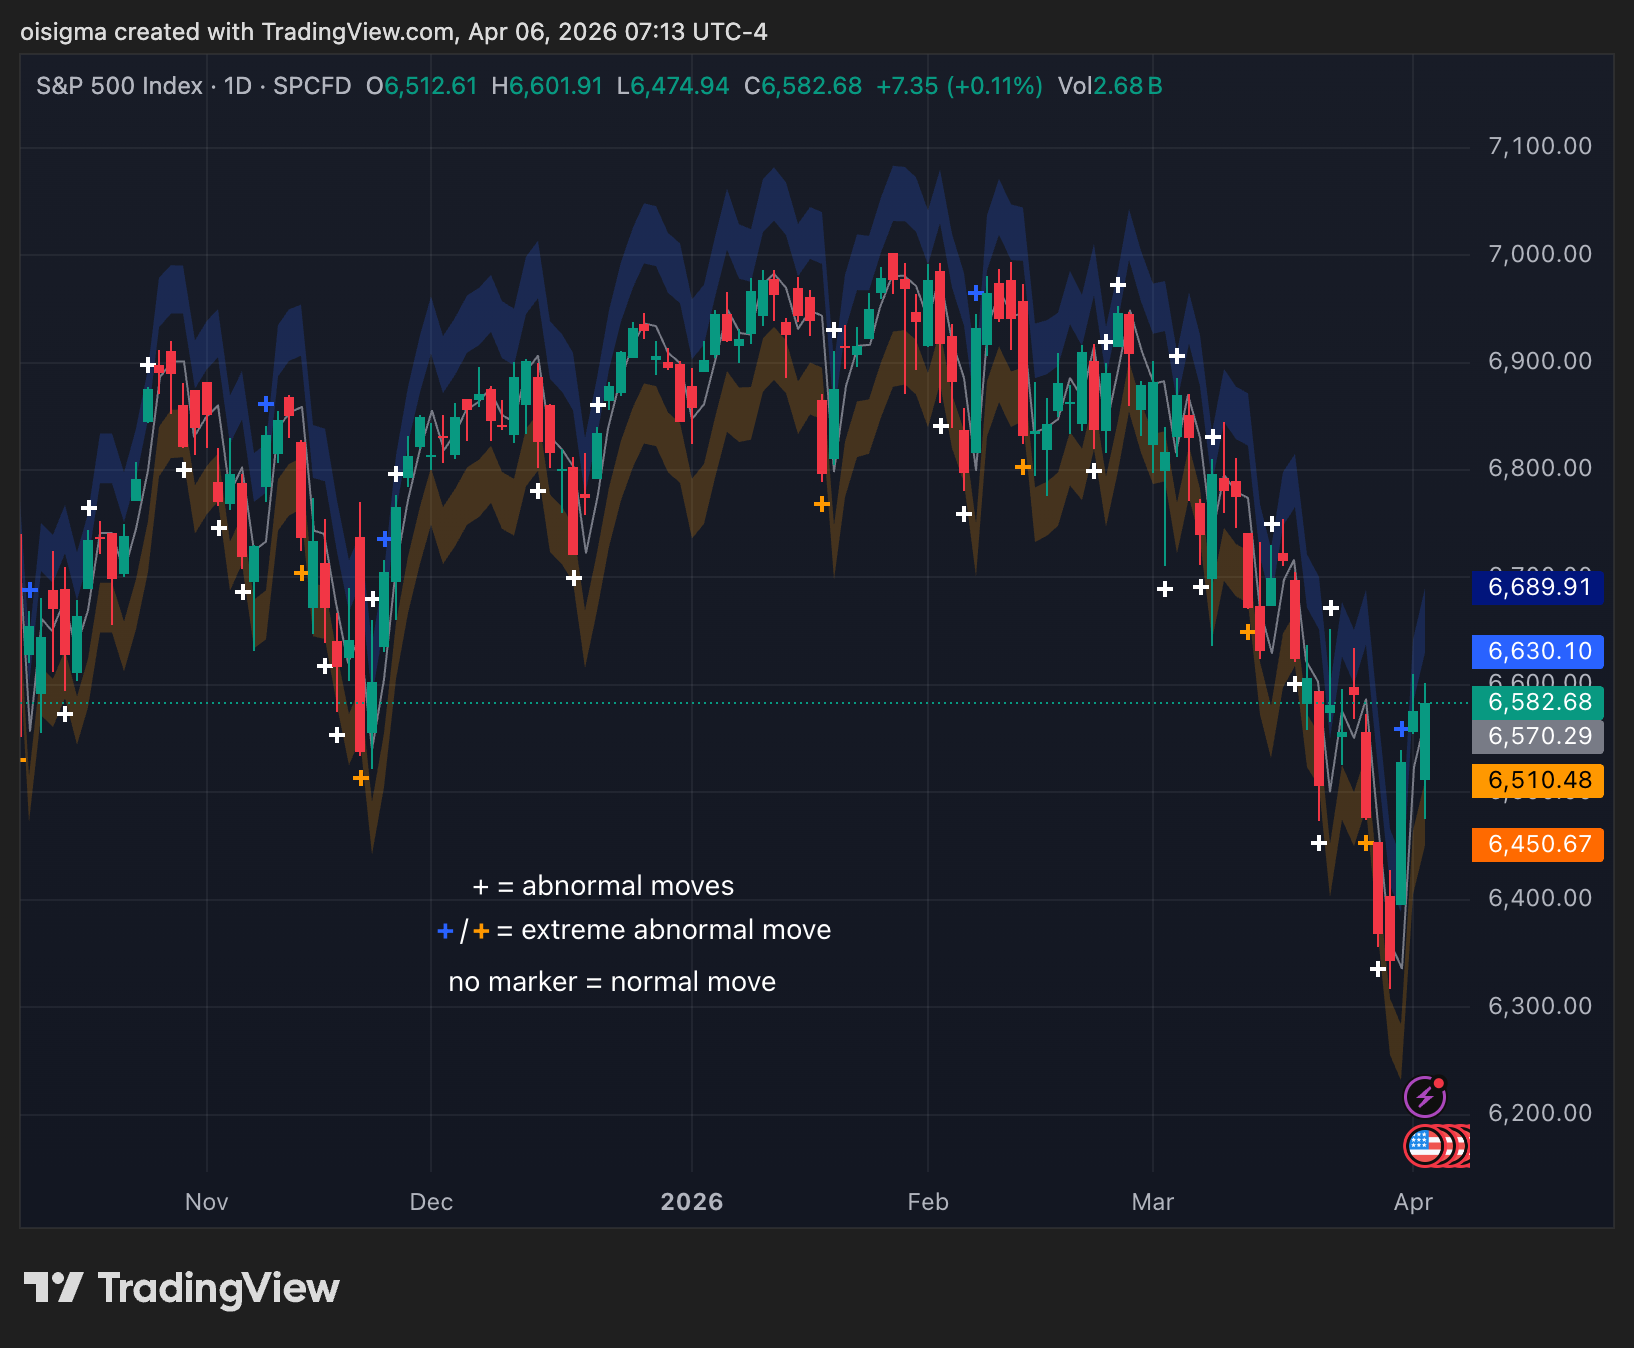
Normal → price stays within its range
Abnormal → price breaks outside it
That is the idea behind behavioral support and resistance.
Example chart
S&P 500 candlestick chart from November 2025 to April 2026 with markers for abnormal and extreme abnormal moves.
Framework
A More Consistent Framework
01
Every bar has a behavioral range.
02
Every move can be evaluated relative to recent conditions.
03
Every chart is interpreted through the same process.
--
No drawing. No guessing. No reinterpretation.
Just a continuously updating view of: Where price is expected to be — and when it isn’t.
Adaptability
As Behavior Changes. The Range Updates.
Markets shift. Volatility expands, contracts, and changes character.
The indicator updates its behavioral range as new bars form, so price is evaluated against recent conditions rather than static historical levels.
Bridge
From Concept to Application
Understanding this idea is one thing.

Applying it consistently — across assets, timeframes, and conditions — is another.

That's where the tool comes in.
Product
BTM applies this framework automatically to every chart.
It provides:
Behavioral support & resistance.
A continuously updating conditional expected price range.
Clear identification of normal vs abnormal behavior.
So you can:
01
Analyze markets with a consistent framework.
02
Understand when price action is behaving normally.
03
Recognize when market conditions may be changing.
Start Seeing Price Differently

See this behavioral support and resistance applied directly to your TradingView chart.
BTM Access:
Start with a 30-day free trial.
Then continue with a monthly subscription.
No long-term commitment.
Cancel anytime.
Compliance
Limits and Scope
01
Requires a TradingView account
Oisigma indicators are delivered through TradingView, so a TradingView account is required to access and use them.
02
Designed for standard candlestick/bar charts
BTM is designed for standard candle/bar charts. Non-standard chart types such as Heikin Ashi, Renko, Range, or other synthetic chart types may alter price behavior and are not supported.
03
Output depends on the selected chart context
The framework evaluates behavior relative to the selected symbol, timeframe, source, and lookback period. Different chart settings may produce different structures.
04
Descriptive, not predictive
BTM helps identify where price is trading relative to its recent behavioral range. It does not forecast future price movement, guarantee outcomes, or provide buy/sell instructions.
05
Use with independent analysis and risk management
Oisigma is an analytical tool intended to support market interpretation. It should be used alongside your own judgment, trading plan, and risk management.